Discover How Employees Spend Their Time with Insightful Categorization
Get extra granularity in your workforce analytics as you further categorize employee time data using Insightful's software employee monitoring tools. Quickly identify productivity patterns and use the mental scaffolding to make better decisions.
.jpg)
Speak with a Productivity Expert
Give us 30 minutes and we’ll show you how we can help you achieve better results.
 |  |  |  |  |  |  | ||||||
|---|---|---|---|---|---|---|---|---|---|---|---|---|
| OVERVIEW | ||||||||||||
| Price | $6/user/month | $6/user/month | $7.20/user/month | $7/user/month | $7/user/month | $9.99/user/month | $6/user/month | $9.99/user/month | $150/licence/year | $60/licence (lifetime) | ||
| Free trial | 7 days | 7 days | No | 14 days | 14 days | 14 days | 30 days | 7 days | Yes | 30 days | ||
| Ease of use | Very easy | Difficult | Very easy | Easy | Easy | Very easy | Very easy | Very easy | Very difficult | Easy | ||
| TRACKING METHODS | ||||||||||||
| Unlimited (tracker working 24/7) | ||||||||||||
| Fixed (defined working hours) | ||||||||||||
| Automatic (when computer is connected to a specified network) | ||||||||||||
| Manual (start/stop) | ||||||||||||
| Project based (track time only on projects) | ||||||||||||
| GENERAL MONITORING FEATURES | ||||||||||||
| Stealth mode | ||||||||||||
| App and website usage | ||||||||||||
| Real-time monitoring | ||||||||||||
| Offline time tracking | ||||||||||||
| Attendance | ||||||||||||
| Activity levels | ||||||||||||
| Keylogger | ||||||||||||
| Geolocation | ||||||||||||
| Remote desktop control | ||||||||||||
| Website/activity blocking | ||||||||||||
| SCREENSHOTS AND RECORDING | ||||||||||||
| Screenshots | ||||||||||||
| Screenshots on demand | ||||||||||||
| Screen recording | ||||||||||||
| PRODUCTIVITY FEATURES | ||||||||||||
| Productivity trends | ||||||||||||
| Websites and apps labeling | ||||||||||||
| Category labeling | ||||||||||||
| Productivity alerts | ||||||||||||
| ADVANCED SECURITY FEATURES | ||||||||||||
| User behavior analytics | ||||||||||||
| Data loss prevention | ||||||||||||
| Advanced file and web monitoring | ||||||||||||
| REPORTING | ||||||||||||
| Productivity reports | ||||||||||||
| Team reports | ||||||||||||
| Timelines | ||||||||||||
| Email reports | ||||||||||||
| Access management | ||||||||||||
| PLATFORMS | ||||||||||||
| Web | ||||||||||||
| Mac desktop app | ||||||||||||
| Windows desktop app | ||||||||||||
| Linux desktop app | ||||||||||||
| Mobile app | iOS, Android | iOS, Android | iOS, Android | iOS, Android | iOS, Android | Android | ||||||
| Browser extension | Chrome | Chrome | Chrome | |||||||||
| Other | Citrix, VMware | Chrome OS | ||||||||||
| OTHER | ||||||||||||
| Support | Phone, email, online | Phone, email, online | Phone, email, online | Email, online | Phone, email, online, in-person | Online | Phone, email, online | Email, online, Viber, Whatsapp | Phone, email, online, support ticket | Phone, email, online | ||
| Knowledge base | ||||||||||||
| Video tutorials | ||||||||||||
| Integrations | comming soon | |||||||||||
| API | ||||||||||||
| Deployment | cloud, on-premise | cloud, on-premise, AWS, Azure | cloud | cloud | cloud | cloud | cloud | on-premise | cloud, on-premise | on-premise | ||
 |  |  |  |  |  |  |  |  |  | | ||
|---|---|---|---|---|---|---|---|---|---|---|---|---|
| OVERVIEW | ||||||||||||
| Price(per month) | Available upon request | From $2 per user | Available upon request | From $6.40 per user+$16 | Free for up to 75 users | From $2.50 per user | Basic plan:$30 for 5 users+$5 per additional user | From $1.50 per employee | From $4 per user+$8 | From $2.20 per user | $5.99 per user per month | |
| Free trial | 30 days | 14 days | Yes | 14 days | 14 days | 14 days | 30 days | 30 days,no credit card required | ||||
| Ease of use | Difficult | Easy | Difficult | Very easy | Easy | Easy | Difficult | Very easy | Easy | Easy | Easy | |
| FEATURES | ||||||||||||
| Timecard management | ||||||||||||
| Scheduling | ||||||||||||
| Shift Trading | ||||||||||||
| Timesheets | ||||||||||||
| Break time management | ||||||||||||
| Real-time tracking | ||||||||||||
| PTO Management | ||||||||||||
| Payroll | ||||||||||||
| Invoicing | ||||||||||||
| Client billing | ||||||||||||
| GPS tracking | ||||||||||||
| Clock out reminders | ||||||||||||
| Alerts | ||||||||||||
| Manual time | ||||||||||||
| PUNCH-IN METHODS | ||||||||||||
| Web app | ||||||||||||
| Mobile app | ||||||||||||
| Time clock device | ||||||||||||
| Time clock kiosk | ||||||||||||
| Facial recognition | ||||||||||||
| Fingerprint scanning | ||||||||||||
| Geofencing | ||||||||||||
| Group punch-in | ||||||||||||
| REPORTING | ||||||||||||
| Visual reports | ||||||||||||
| Email reports | ||||||||||||
| Time rounding | ||||||||||||
| MANAGEMENT | ||||||||||||
| Permissions | ||||||||||||
| Manager approvals | ||||||||||||
| Add time for others | ||||||||||||
| Integrations | ||||||||||||
| PLATFORMS | ||||||||||||
| Web | ||||||||||||
| Android app | ||||||||||||
| iOS app | ||||||||||||
| Mac desktop app | ||||||||||||
| Windows desktop app | ||||||||||||
| Linux desktop app | ||||||||||||
| OTHER | ||||||||||||
| Support | Phone and online | Phone and online | Phone,chat and online | Phone and chat | Email and online | Chat and phone | Phone,email,chat and online | Phone and online | Phone,email,chat and online | Phone and online | Online chat and video support in English,French,and Spanish | |
| Knowledge base | ||||||||||||
| Video tutorials | ||||||||||||
| Community forum | ||||||||||||
| API | ||||||||||||
 |  | |  |  |  |  |  |  | ||||
|---|---|---|---|---|---|---|---|---|---|---|---|---|
| OVERVIEW | ||||||||||||
| Price (per month) | $6 per user | $5.83 per user | $9 per user | $9.99 per user | $10.80 per user | $5.25 per user | $99 for 5 users | $7 per user | $19 for 10 projects | $5 per user | ||
| Free trial | 7 days | 14 days | 30 days | 14 days | 30 days | Yes | 14 days | 14 days | 30 days | 30 days | ||
| Ease of use | Very easy | Difficult | Difficult | Very easy | Easy | Very easy | Easy | Difficult | Very easy | Difficult | ||
| TIME TRACKING METHODS | ||||||||||||
| Manual | ||||||||||||
| Start/stop buttons | ||||||||||||
| Automatic time mapping | ||||||||||||
| IN-DEPTH TASK AND PROJECT ANALYSIS | ||||||||||||
| Screenshots | ||||||||||||
| App and website usage | ||||||||||||
| Activity levels | coming soon | |||||||||||
| Real-time tracking | ||||||||||||
| TASK AND PROJECT MANAGEMENT | ||||||||||||
| Project adding | ||||||||||||
| Project templates | ||||||||||||
| Project status | ||||||||||||
| Task assignment | ||||||||||||
| Task priorities | ||||||||||||
| Budgeting | coming soon | |||||||||||
| Mark billable/non-billable hours | ||||||||||||
| Payroll calculation | ||||||||||||
| Invoicing | ||||||||||||
| ALERTS | ||||||||||||
| Idle time reminders | ||||||||||||
| Deadline alerts | coming soon | |||||||||||
| Budget alerts | coming soon | |||||||||||
| REPORTING | ||||||||||||
| Client login | ||||||||||||
| Productivity analysis | ||||||||||||
| Email reports | coming soon | |||||||||||
| PLATFORMS | ||||||||||||
| Web | ||||||||||||
| Mac desktop app | ||||||||||||
| Windows desktop app | ||||||||||||
| Linux desktop app | coming soon | |||||||||||
| iOS app | Beta | |||||||||||
| Android app | ||||||||||||
| Browser extension | Chrome | Chrome, Firefox | Chrome | Chrome | Chrome, Firefox | Chrome | Chrome, Firefox, Opera, Edge | |||||
| OTHER | ||||||||||||
| Support | Phone and online | Email and online | Email and online | Online | Online, email and phone | Email, online and support ticket | Email and chat | Email and chat | Chat | |||
| Knowledge base | ||||||||||||
| Video tutorials | ||||||||||||
| Integrations | coming soon | |||||||||||
| API | ||||||||||||
| On-premise hosting | ||||||||||||
You’ve organized time data for your workforce, and you have a clear understanding of productivity trends based on time spent on tasks and projects.
Yet it can be challenging to dig into the specifics and know exactly how much each team member contributes, and where to look to improve baseline performance.
This is why it’s important that you’re able to see an overview of how much time employees are spending across various work-related activities at both an individual and a team level.
Luckily Insightful solves the issue of how to monitor employees working from home or in the office and has double down on its capabilities with the new Categorization feature.
One of many new exciting features coming to your workforce analytics solution over the next year, users will now be able to view apps and websites according to the nature of the work teams are performing. Insightful will automatically assign these categories for you, providing an additional layer of insight into workforce productivity.
They’ll also have the option to zoom out for a more holistic view of how employee work time is divided between core tasks, admin activities, collaborative efforts, and any other work activities you’d like to track.
Curious to learn more about how categorization can help you manage time in your organization?
Let’s take a look at everything you can expect with this exciting new feature.
How Categorization Brings New Productivity Insights
Categorization is an excellent way of organizing information and data into ‘buckets’ so you can interpret and analyze it more effectively.
Take business ownership as an example.
By dividing out your core business tasks into areas such as:
- Marketing
- Sales
- HR
- IT
You’re able to clearly distinguish responsibilities from one department to the next and make it easy to evaluate the performance of each area.
The same logic applies to Insightful’s new categorization feature: we’re giving you the ability to sort your time data in a more granular way so you can extract more valuable insights from it.
Currently, users can see how employees and teams spend their work hours related to the websites and apps they use on a regular basis.
With the categorization feature, we’re providing an extra layer of depth so you can dig into the details of work hour allocation and really zero in on wasted time, productive time, and evaluate the usage of particular websites and apps for different teams.
For example, now you’ll have the option to see if your marketing team is sinking the majority of their time into collaborative software or browsing the internet through search engines.
This extra clarity should help you make data-backed strategic decisions regarding different teams within your organization and how you can best deploy your resources.
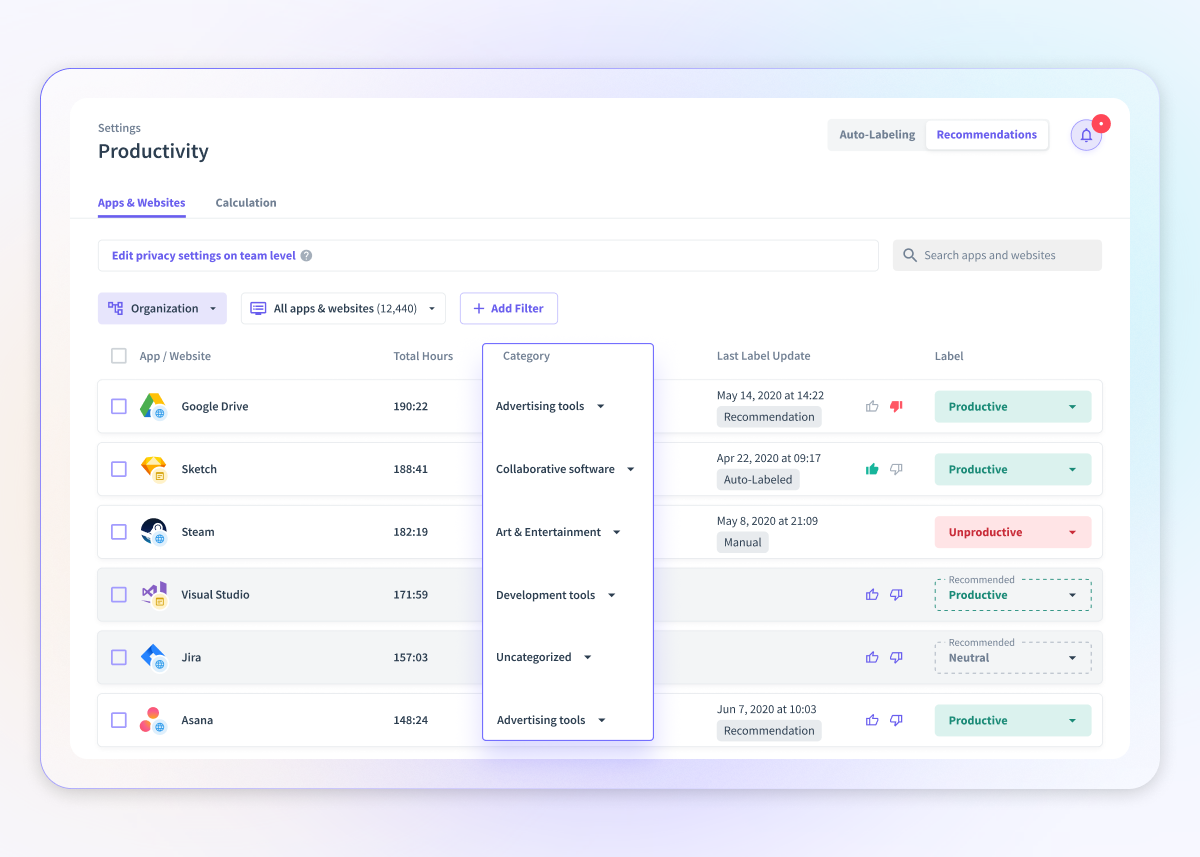
Productivity Settings Page
What’s New with Categorization?
Now you’ve got a basic idea of what to expect with this new feature, let’s get hands-on with a few practical use cases that demonstrate exactly how you can use categorization in your organization for improved workforce analytics.
Understanding Time Allocation According to Categories
With the new categorization feature, you gain insights into how much time your teams spend on different work-related activities - giving you a true sense of the nature of work they’re completing on a regular basis.
With a more holistic view of app and website usage statistics, it’s easier to pinpoint specifics when you’re thinking about workforce productivity. As a result, identifying and interpreting work patterns becomes much more straightforward.
Now, you don’t have to rely on assumptions about how each of your teams spend their time - you can quickly uncover insights using concrete, categorized data.
You can instantly answer questions such as these:
- Is your sales team really spending several hours a day managing client data in CRMs?
- Is it true that some team members are engaging with adult/illegal material during work hours?
- How much time does the HR department spend on communication tools each day?
Insightful will automatically categorize apps and websites into one of 16 predefined categories, but users are free to change the categories if it makes more sense for their productivity analytics.
Individual Employee Page

Faster Identification of Work Patterns
Insightful allows you to keep your finger on the pulse of workforce performance through automated time tracking and trend spotting.
Yet with the categorization feature, we’re going to speed up the pattern recognition process.
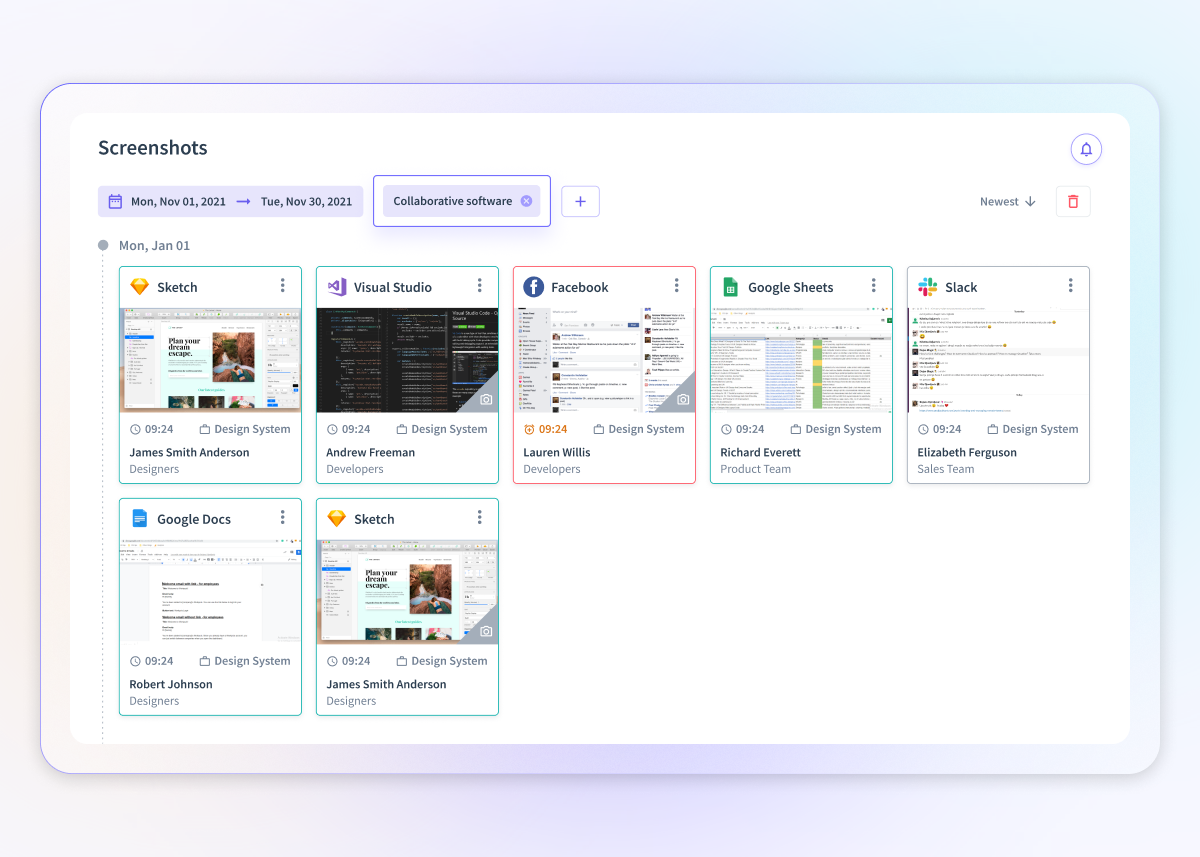
You’ll see these new categories as a new ‘categorization’ column, which you’ll find in the following pages:
- Productivity
- Individual employee pages
- Productivity trends
- Screenshots
- Activity logs
- Audit logs
Screenshots Page
So now, instead of double checking each website and app your teams use to verify its purpose, you can now assign them all to one of 16 categories for quick identification.
Slack -> communication.
Trello -> collaboration.
Bloomberg -> news.
Google -> search engine.
Hubspot -> CRM.
And so on.
Rather than remembering dozens of app names and company website domains, you can now simplify your data organization process for faster - and more accurate - pattern recognition.
Informed Decision-Making
Making the best strategic decisions is often a case of using the best data you have available to you.
By speeding up work pattern recognition, and further distilling time data down into various categories, you’re working with the most accurate data at any given moment. Especially since users can change categories themselves to make sure they truly reflect the work they’re doing.
It’s easier than ever before now to glean actionable insights from your workforce data as categories provide the mental scaffolding to make faster, more efficient decisions.
Audit Logs Page

Share Feedback In-App
Most processes live or die based on user feedback, as it helps everyone stay in alignment and ensure the processes continue to move you in the right direction.
Since this is our first AI-supported feature, with automatic category assignment for apps and websites, your continued feedback will help us create the best user experience for you and tailor categorization to your specific business needs.
Insightful will automatically organize apps and websites into predefined categories, and admins can change them if necessary to suit their specific employees and teams. You’ll then be prompted to leave feedback (with a thumbs-up or thumbs-down) if you wish to do so to help us improve your user experience.
We’ll register every category change you make and feedback you leave for us to make sure the categorization feature works for your specific situation.
This feedback is invaluable for us as it’ll help us refine our categorization system over time.
Productivity Settings Page

What’s on the horizon?
Now let’s take a look at how the categorization feature will evolve over the next few months to help you get the most out of your workforce data.
Organize Data Your Way with Tags
By Q1 next year, we’ll release the next version which will introduce customization tags at the app and website level.
With the release of tags, users will be able to take the categorization process into their own hands and fully customize their reporting. Users can use these tags to categorize activities using their own labels and terms, and filter both apps and websites to suit their specific needs.
Plus, color-coding allows for quick identification at a glance.
What this means is users will be able to add their own labels for apps and websites to further clarify what type of app or website it is they’re using and how it pertains to their workflows.
When employees engage with a particular app that allows them to make strategic forecasts and plan future projects you could categorize the time as ‘strategic planning’. If they use a website to block out external distractions, you could categorize the time as ‘deep work’.
Plus, when admins assign tags to certain apps and websites, they can designate specific activities as core work. This allows for greater insights into how much time teams are spending on their main work responsibilities.
If teams are getting pulled in different directions and getting sidetracked, their managers will see this through the tags and can step in to help them schedule their time effectively and get back on track.
Get Clear Insights into Employee Work Activities
You can expect to work with the final version of the categorization feature by next year.
With the final version of categorization, we’ll introduce comprehensive reports that you can use to extract actionable insights about your workforce patterns.
These reports will provide you with a comprehensive breakdown of categories and tags in one place for an even more holistic understanding of where most time is being spent.
With them, users will be able to tease out repeated work patterns and understand exactly how teams and individuals are spending their work hours across various types of activities. You can also download these reports as PNG files, which you can then easily share with other admins and managers.
Plus, you’ll now have the option to share reports in-app for a frictionless data analytics experience.
So what types of insights can you get with these reports?
- Keep up with usage trends - Learn more about how employees interact with apps and websites at different times of day and stages of the year. It could be that teams use ‘strategic planning’ tools more in Q1 than the rest of the year, or that your marketing department always seems to communicate most in the first hour of the day.
- Track location-based productivity - Collect productivity insights according to where your employees are located. For example, are they using social media more often remotely than they would while working from the office?
- Group activities based on categories - Find out how many employees and teams are using specific categories. From there, you can determine whether work time is being spent on the right activities to meet your strategic business goals.
Learn more - read our help article.
Related Posts

The Drive Behind Innovation & Customer Success: Insightful Welcomes Jack Zimnavoda
We're excited to welcome Jack Zimnavoda to Insightful as our new Head of Customer Success. Jack joins us with a fresh perspective on customer advocacy and operational efficiency. His vision, enthusiasm, and willingness to tackle challenges head-on reflect our own core values.


Transform Your Workplace with Insightful’s New Reporting Feature
Get actionable insights right away with Insightful's new Work Type Reports. Revolutionize your workplace by identifying workforce patterns and optimizing productivity.

Insightful Dominates G2 Winter 2024 Rankings: Leading the Charge in Employee Productivity Software
Discover how Insightful's suite of remote work tools and employee monitoring solutions topped G2's Winter 2024 rankings, enhancing productivity and well-being in the digital workplace.


